Modified True/False
Indicate
whether the statement is true or false. If false, change the identified word or phrase to make
the statement true.
|
|
|
1.
|
The control variable shows the effect of changes in the independent
variable. ___________________________________.
|
|
|
2.
|
An experiment is most reproducible when errors are small.
_________________________
|
|
|
3.
|
Two measurements are considered significantly different if their
difference is less than or equal to the amount of error. _________________________
|
Multiple Choice
Identify the
choice that best completes the statement or answers the question.
|
|
|
Jordan noticed that as he stood farther away from his desk lamp, the light from
the lamp seemed dimmer. He borrowed a light meter from his brother, who is a photographer, and
decided to test his observation.
|
|
|
4.
|
Jordan used a light meter to measure the brightness of his lamp at various
distances. Distance is the:
a. | control variable. | b. | hypothesis. | c. | analysis. | d. | experimental
variable. |
|
|
|
5.
|
Once Jordan takes his measurements, he puts his data into a graph. This is
called:
a. | a hypothesis. | b. | an analysis. | c. | a
conclusion. | d. | a procedure. |
|
|
|
6.
|
A control variable for Jordan’s experiment would be:
a. | the light bulb. | b. | the distance from the lamp. | c. | the amount of time
the lamp is turned on. | d. | the data. |
|
|
|
7.
|
A variable that is unchanged throughout an experiment is called the:
a. | control variable. | b. | experimental variable. | c. | independent
variable. | d. | dependent variable. |
|
|
|
8.
|
During the Olympics the winning times below were recorded for the women’s
400-meter freestyle swimming race. Year | Time (s) | 1960 | 4.66 | 1964 | 4.73 | 1968 | 4.51 | 1972 | 4.32 | 1976 | 4.17 | 1980 | 4.15 | 1984 | 4.12 | 1988 | 4.07 | | |
The average
time for the 400-meter race is:
|
|
|
9.
|
Which of the following hypotheses could be tested by an
experiment?
a. | A chocolate bar tastes better than potato chips. | b. | The harder you push
a small wagon, the faster it goes. | c. | Aliens control everything that happens on
Earth. | d. | All of the above |
|
|
|
10.
|
Which of the following data sets has an average of 2.0?
a. | 1.0, 2.0, 3.0, 4.0 | b. | 1.0, 1.5, 2.0, 2.5 | c. | 0.5, 1.5, 2.5,
3.5 | d. | 1.5, 1.7, 2.5, 2.7 |
|
|
|
11.
|
How are data and a hypothesis different?
a. | There is no difference. | b. | Data is not part of an
experiment. | c. | A hypothesis is not part of an experiment. | d. | A hypothesis is a
prediction based on data. |
|
|
|
A group of students each measured the mass of a large paperclip on a mass
balance. Their results are in the table below: | Student | Mass
(g) | | Jacob | 1.02 | | Scott | 0.99 | | Maddy | 0.97 | | Alyssa | 0.98 | | |
|
|
|
12.
|
What is the average for the group?
|
|
|
13.
|
What is the error in Jacob’s measurement?
a. | zero | b. | 0.02 | c. | 0.03 | d. | 0.005 |
|
|
|
14.
|
Who has the most accurate measurement?
a. | Jacob | b. | Scott | c. | Maddy | d. | Alyssa |
|
|
|
15.
|
Lucas joined the group and measured the mass of the paperclip as 1.03 grams.
Which statement about Lucas’ measurement is correct?
a. | His measurement is considered the same as the group’s. | b. | His measurement is
significantly different from the group’s. | c. | You can’t make any statements about his
measurement. | d. | All the measurements have significant error. |
|
Completion
Complete each
statement.
|
|
|
Select the correct term to complete each sentence. There are extra terms in
the list.| significant | not significant | analysis | | conclusion | hypothesis | graph | | x | y | unit | | accuracy | error | data | | quantity | balance | spring scale | | | |
|
|
|
16.
|
A difference in measurements is ____________________ if the difference is
greater than the amount of error.
|
|
|
17.
|
A ____________________ is a statement of what you learned from an
experiment.
|
|
|
18.
|
____________________ is how close a measurement is to the true value of what is
being measured.
|
|
|
19.
|
____________________ is the difference between a measurement and the true value
of what you are trying to measure.
|
Short Answer
|
|
|
20.
|
Bonita set up an experiment to test the effect of salt water on the germination
of plant seeds. She used 4 different concentrations of salt water to water seeds in different plant
pots, along with one plant pot she watered with plain water, and counted how many seeds sprouted in
each pot.
a. What is the experimental variable in this experiment?
b. What is one
control variable in this experiment?
c. Write a hypothesis for what Bonita may be
testing.
|
|
|
Kosta decides to cook some pasta noodles. He notices that the directions say to
add salt to the water before bringing the water to a boil. The next day, Kosta asks his science
teacher, Ms. Jackson, a question: "How does adding salt affect the boiling temperature of
water?" Of course, Ms. Jackson asks Kosta to plan and conduct an experiment to find the
answer. The following graph summarizes Kosta’s results. 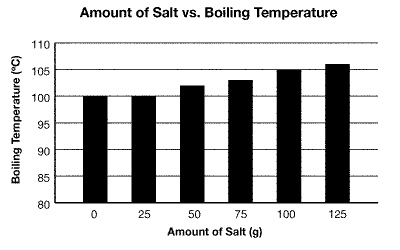
Figure 2-1
|
|
|
21.
|
According to the graph in Figure 2-1, how much salt results in the highest
boiling temperature?
|
|
|
22.
|
What is the independent variable for the graph in Figure 2-1?
|
|
|
23.
|
What are two possible control variables for the experiment shown in
Figure 2-1?
|
|
|
24.
|
Use the graph below to predict the speed of the car when the car is at 60
centimeters: 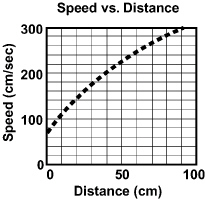
|
|
|
25.
|
Why is it important to change only one experimental variable at a time in an
experiment?
|
Problem
|
|
|
A group of 5 students, each with stopwatches, timed Marianna in the 100-meter
dash. Their results are in the table below: | Student | Marianna’s Time
(s) | | 1 | 13.47 | | 2 | 13.50 | | 3 | 13.51 | | 4 | 13.50 | | 5 | 13.52 | | |
|
|
|
26.
|
a. What is student 3’s error?
b. What is student 4’s
error?
|
|
|
27.
|
a. What is the group’s average time for Marianna’s run?
b. What
is the true value of Marianna’s run?
|
|
|
28.
|
A graph is 50 boxes by 50 boxes. Time is plotted
on the x-axis and its range is 0 to 100 minutes. Position is plotted on the y-axis and
the range is 0 to 50 meters. What should the scale be for each axis of this graph?
|
Other
|
|
|
29.
|
The data table below contains information from an experiment where a car was
rolling down a ramp. | Distance (cm) | Speed (cm/s) | 10 | 100 | 20 | 140 | 30 | 171 | 40 | 198 | 50 | 221 | 60 | 242 | 80 | 280 | 90 | 297 | | |
| a. | What is the dependent variable for this
experiment? | | b. | Create
a graph based on the above data set. Make sure your graph has the proper parts (title, labels with
units, data points, best fit curve.) | | |
|