Modified True/False
Indicate
whether the statement is true or false. If false, change the identified word or phrase to make
the statement true.
|
|
|
1.
|
A hypothesis is a quantity that can be precisely specified.
_________________________
|
|
|
2.
|
When one variable decreases as the other variable increases, the variables have
an inverse relationship. _________________________
|
|
|
3.
|
Control variables are those that are changed in an experiment.
_________________________
|
|
|
4.
|
The information you collect in an experiment in order to answer a question is
called data. _________________________
|
|
|
5.
|
The control variable shows the effect of changes in the independent
variable. ___________________________________.
|
Multiple Choice
Identify the
choice that best completes the statement or answers the question.
|
|
|
6.
|
The independent variable on a graph can be described as the variable:
a. | represented on the x-axis. | b. | causing the change in the dependent
variable. | c. | over which a scientist usually has direct control when designing the
experiment. | d. | All of the above |
|
|
|
7.
|
A graph may be described as all of the following EXCEPT:
a. | a tool to be interpreted only by trained scientists and
mathematicians. | b. | a good way to describe the relationship between two variables. | c. | a mathematical
diagram. | d. | a model. |
|
|
|
8.
|
In an inverse relationship:
a. | as one variable increases, so does the other. | b. | when one variable
increases, the other decreases. | c. | there is no change in data. | d. | variables change
randomly. |
|
|
|
9.
|
The type of relationship represented between variables in the graph pictured
is:  a. | a strong relationship. | b. | a weak relationship. | c. | an inverse
relationship. | d. | no relationship. |
|
|
|
10.
|
On this graph, the dependent variable is: 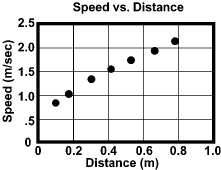 a. | distance. | b. | speed. | c. | acceleration. | d. | the slope of the speed vs. distance
curve. |
|
|
|
Each of the four graphs pictured in the diagram below shows a relationship
between variables. 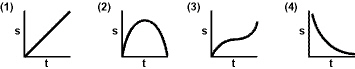 Figure 2-1 Figure 2-1
|
|
|
11.
|
Which of the graphs in Figure 2-1 shows a complex relationship?
|
|
|
12.
|
Which graph in Figure 2-1 shows an inverse relationship?
|
|
|
13.
|
Which of the graphs in Figure 2-1 show a direct relationship?
a. | 1 and 2 | b. | 1 and 3 | c. | 3 and
4 | d. | 2 and 4 |
|
|
|
14.
|
The density of an object is equal to the mass of the object divided by its
volume. If d represents density, m represents mass, and V represents volume, the
formula for the density of an object is:
|
|
|
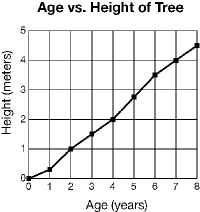 Figure 2-2 Figure 2-2
The above graph is
of the height of an avocado tree plotted against its age from the time it is planted to when it is 8
years old.
|
|
|
15.
|
What is the independent variable for the graph in Figure 2-2?
a. | Height | b. | Age | c. | Type of
tree | d. | There is no independent variable |
|
|
|
16.
|
What is the dependent variable for the graph in Figure 2-2?
a. | Height | b. | Age | c. | Type of
tree | d. | There is no dependent variable |
|
|
|
17.
|
What is the relationship between variables for the graph in Figure 2-2?
a. | Complex | b. | Direct | c. | Inverse | d. | No relationship |
|
|
|
18.
|
How tall was the avocado tree in Figure 2-2 when it was 5 years old?
a. | 2 m | b. | 2.5 m | c. | 2.75
m | d. | 3 m |
|
|
|
19.
|
Which of the following formulas is NOT mathematically correct?
|
|
|
20.
|
Solve the equation  for the variable b.
|
|
|
Jordan noticed that as he stood farther away from his desk lamp, the light from
the lamp seemed dimmer. He borrowed a light meter from his brother, who is a photographer, and
decided to test his observation.
|
|
|
21.
|
To determine the relationship between distance from his lamp and the brightness
of his lamp Jordan should:
a. | perform a scientific experiment. | b. | assume that the lamp must be losing electricity
as he moves away from it. | c. | ask someone at home. | d. | There is no way to
figure out the relationship. |
|
|
|
22.
|
When Jordan prepares a graph of the data:
a. | the distance away from the lamp should be represented on the
x-axis. | b. | the brightness of the lamp should be represented on the
x-axis. | c. | it doesn’t matter which variable he places on the
x-axis. | d. | he will need more information before deciding where to place the
variables. |
|
Completion
Complete each
statement.
|
|
|
Select the correct term to complete each sentence. There are extra terms in
the list.| significant | not significant | analysis | | conclusion | hypothesis | graph | | x | y | unit | | accuracy | error | data | | quantity | balance | spring scale | | | |
|
|
|
23.
|
The detailed explanation of the results of an experiment is called the
____________________.
|
|
|
24.
|
A mathematical diagram that shows how two variables are related is called a
____________________.
|
|
|
25.
|
On a graph, the independent variable is represented on the
____________________-axis.
|
|
|
26.
|
If the mass of your textbook is 3 kilograms, kilograms specifies the
____________________.
|
|
|
27.
|
In a direct or linear relationship between two variables, when one variable
increases, the other variable ____________________.
|
|
|
28.
|
Mass is measured using a ____________________.
|
Problem
|
|
|
29.
|
Solve the following equations for a: a. a + 9 = 18 -
2 a
b.  c. 
|
Essay
|
|
|
30.
|
Think about the relationship between the amount of gas you have in your car and
how far you can travel. Which is the dependent variable? Which is the independent variable? What type
of relationship would you expect to see between the variables.
|