Modified True/False
Indicate
whether the statement is true or false. If false, change the identified word or phrase to make
the statement true.
|
|
|
1.
|
On a distance vs. time graph, constant speed is indicated by a straight,
horizontal line. _________________________
|
|
|
2.
|
The speed of an object can found on a distance vs. time graph by calculating the
area under the line of the graph. _________________________
|
Multiple Choice
Identify the
choice that best completes the statement or answers the question.
|
|
|
3.
|
The data for a runner is used to produce a graph of speed vs. time. If
the line of the graph is a straight horizontal line, this indicates the runner is:
a. | running with constant speed. | b. | running with increasing
speed. | c. | running with decreasing speed | d. | motionless; not
running. |
|
|
|
4.
|
The graph below represents the motion ball rolling across the floor of a room.
The average speed of the ball is: 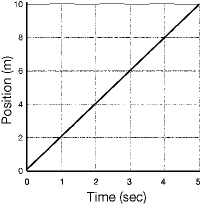 a. | 0.5 m/s | b. | 2 m/s | c. | 5
m/s | d. | 50 m/s |
|
|
|
5.
|
The graph represents the motion of two cars, A and B. During the time from t = 0
seconds to t = 5 seconds, car A is: 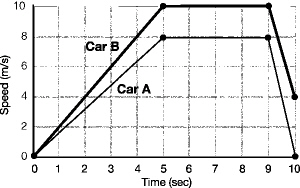 a. | moving with constant speed. | b. | moving with increasing
speed. | c. | moving with decreasing speed. | d. | motionless; not
moving. |
|
|
|
6.
|
The graph below was created from data taken as a runner was warming up for a
track meet. The interval during which the runner is moving fastest is: 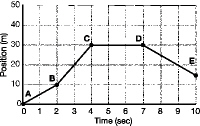
|
|
|
7.
|
The graph represents the motion of a cyclist as he begins to pedal from a stop
sign at an intersection. 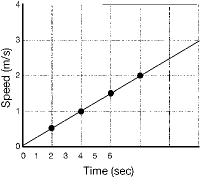 The total distance covered by the cyclist
during the first four seconds is:
|
|
|
The graph below represents the motion of a cart rolling across the
floor. 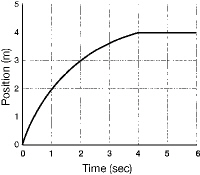 Figure 12-1A Figure 12-1A
|
|
|
8.
|
According to the graph in Figure 12-1A, the speed of the cart at t = 5 seconds
is:
a. | 0.0 m/s | b. | 2.0 m/s | c. | 4.0
m/s | d. | 5.0 m/s |
|
|
|
9.
|
According to the graph in Figure 12-1A, during the first 4 seconds, the car
is:
a. | motionless; not moving. | b. | moving with constant speed. | c. | moving with
increasing speed. | d. | moving with decreasing
speed. |
|
|
|
10.
|
The graph below represents the motion of an object. The speed of the object is
changing during interval: 
|
|
|
11.
|
The data for a runner is used to produce a graph of position vs. time. If
the line of the graph is a straight horizontal line, this indicates the runner is:
a. | running with constant speed. | b. | running with increasing
speed. | c. | running with decreasing speed. | d. | motionless; not
running. |
|
|
|
12.
|
The graph shows the distance covered by a battery operated car plotted against
time. 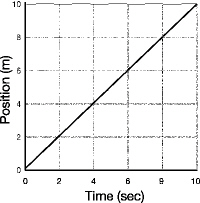 The distance covered by the car from time
= 2 seconds to time = 6 seconds is:
|
Short Answer
|
|
|
13.
|
Write the equation for calculating the slope of the line of a position vs.
time graph.
|
|
|
14.
|
Becca and Sam each walk a 100-meter course on their school’s track. Each
of their walks are plotted on a single distance vs. time graph. If you didn’t have a chance to
watch them in person, how could you use the distance vs. time graph to figure out who walked
faster?
|
Problem
|
|
|
15.
|
The graph represents the motion of two cars, A and B. During the first 5
seconds, which car is moving faster? How do you know? 
|
|
|
16.
|
The graph below represents the motion of two cars, A and B, moving on a straight
track. 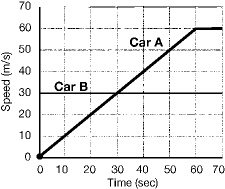 Calculate the distance car B moves in 60
seconds.
|
|
|
17.
|
The distance vs. time graph below represents the position of an object
moving in a straight line. Calculate the speed of the object from 2 seconds to 4 seconds. 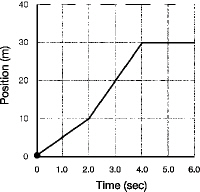 For full credit, write an equation, substitute in the equation with
units, and give an answer labeled with units.
|